Drone Imagery Web Application.
This application features A WebApp and Server built using <a href="https://angularjs.org/">Angular JS</a> with UI Components built using <a href="https://material.angular.io/">Angular Material</a>.

Technologies Used: Web (HTML,JavaScript,CSS) with <a href="https://angularjs.org/">Angular JS</a>
Table of Contents
- Introduction
- Data
- Architecture
- Results
- Setup
Introduction
The objective of this project was to monitor the conservation process of the renaturation of the River Aa in Münster using unmanned aerial system (UAS) technology. Focusing on the hydromorphological quality of the river, the following questions were proposed: (1) How does the stream velocity change by the renaturation? (2) How has the vegetation and land use and land cover characteristics (LULC) changed? (3) How did the river bed and the shore structure change? The emphasis was to learn how to collect, process, and visualize the data using UAVs to provide insight to these questions and to visualize this data. The project was consisted of three main phases: data collection→ image/video processing → a Web-based visualization.
UAS can offer numerous advantages for ecological projects such as this: high resolution images (due to capability to capture data in low altitude), a flexible and easy to control acquisition area, an adjustable spatial resolution and portability. Moreover, by attaching various sensors, different bands of the electromagnetic spectrum can be analyzed and provide a low-cost remote sensing technique (Duan et al., 2017; Sutheerakul et al., 2017; Sankaran et al., 2015). These advantages underline the motive of using UAS to evaluate and monitor the renaturation of the Aa river, especially given relatively small research area and the need for high resolution images.
During the data acquisition phase, RGB, multispectral and thermal cameras were attached to the drone to capture multispectral images of the River Aa and its surrounding environment, as well as the movement the floating thermal object used to measure river velocity. The image and video processing groups used the data to produce the various orthomosaic images (e.g the NDVI and the digital elevation model) in addition to flight videos to track the thermal object’s movement. To present the end products, a web application was selected due to its capability to integrate spatial products as multi-layer spatial objects within single platform (Moncrieff et al., 2016). In collaboration with ESRI Cloud, web standards such as Web Map Service (WMS), Web Feature Service (WFS) and Web Map Tile Service (WMTS) facilitated serving the processed images as georeferenced spatial objects, in an integrated and continuous manner. Thus, the web portal aimed to convey the end products such as the orthomosaic images, NDVI, the land use and land cover (LULC) map, and the digital elevation model (DEM) using these OGC-compliant services.
To present the end products, a web application was selected due to its capability to integrate spatial products as multi-layer spatial objects within single platform (Moncrieff et al., 2016). In collaboration with ESRI Cloud, web standards such as Web Map Service (WMS), Web Feature Service (WFS) and Web Map Tile Service (WMTS) facilitated serving the processed images as georeferenced spatial objects, in an integrated and continuous manner. Thus, the web portal aimed to convey the end products such as the orthomosaic images, NDVI, the land use and land cover (LULC) map, and the digital elevation model (DEM) using these OGC-compliant services.
By using the website, the user is able to explore research area, images and maps derived from the drones to better understand hydromorphological condition of River Aa Münster. The creation of this website allows the user to answer the underlying research questions regarding LULC, stream behavior, vegetation development, river bed and structure change during the renaturation process. In this report the process taken to achieve the Web portal is described in the following structure: Introduction, Data, Web Design, Functions and Widgets, Results and Discussion.
Data
The data used in the project can be divided into two major categories: ESRI cloud products and raw data obtained directly from the other groups. With both cases a post-processing stage, the adaptation to a Web product, was required. In the table below, the final data in the web application is displayed:
| Raw data | ESRI Cloud Product (WMTS or WFS) |
|---|---|
| Floating Points Data (.CSV) | Mosaic Layer (WMTS) |
| Video Data (.MP4) | DSM/DEM Layer (WMTS) |
| Classification (.SHP) - Polygon Layer* | NDVI Layer (WMTS) |
| River Center (.SHP) - Line Layer* | False Color Layer (WMTS) |
| River Outline (.SHP) - Line Layer* | Aspect Layer (WMTS) |
| Trees (.SHP) - Point Layer* | Slope Layer (WMTS) |
| Hillshade Layer (WMTS) | |
| Flight Plan Layer (WFS) | |
| 3D Layers Layers (iFrame) |
Using the ESRI cloud data has posed numerous advantages over having the image served locally on the server. First, the dedicated library ( ESRI Leaflet) has ensured full compatibility between the various image formats and the Leaflet map: georeferencing and cached tiling (allowing for faster loading times) occurred automatically and efficiently. Secondly, since the data was hosted on the ArcGIS Online server, it did not take up excess storage on the university’s server. Finally, it has spared the need for dedicated libraries for each of the the numerous image formats of the Image Analysis Group products (e.g. .LAS, .PLY, .DXF). To enable the layer as an OGC compliant WMTS required us to collaborate with the ESRI group and to gain access to the ESRI ArcGIS portal for specific configuration for each layer presented. The seven tile layers displayed can also be viewed concurrently, and the user is able to overlay, for example, a satellite-streets basemap with the mosaic and the flight plan layers overlaid upon each other.
Using WMTS, however, presented several limitations: the technical capabilities of these layers was limited to “Map” and “TileOnly”. Thus, querying the image pixel values was not possible, without the use of ArcGIS Server which was not available for this project. A workaround that issue was achieved by analyzing the raw image pixel values to create a custom legend in Leaflet, a task completed for the DSM layer where values are crucial. For the flight plan layer, querying the data was possible since WFS as used. The properties of the flight plan layer were queried to obtain the altitude value, and were made available at each segment of the flight “line”. Likewise, the altitude value range was normalized and a custom legend with a color scale was implemented, to illustrate the changes in flight altitude.
Visualizing the 3D products created by the image analysis group proved to be challenging. One open-source library capable of handling the particular formats plas.io did not offer an integrated plug-in, but rather a standalone platform to visualize point cloud data (.LAS). Moreover, the raw data was also large in size (200MB>) and would take considerable processing and storage resources from the server. Consequently, ESRI’s 3D platform (ArcScene) was embedded in the Webportal using an iFrame, allowing the user maximum capability to view the various layers, pan, zoom and navigate around the point cloud.
The floating points data was received from the video processing group as three CSV files, one each for each floating point experiment, with the following fields: Easting, Northings, and time. The adaption to Web required several steps: an off-line transformation of the UTM coordinates to EPSG 3857 (Leaflet’s default CRS), creating an AJAX call to retrieve the data, and finally visualize each data point in the correct order with a marker.
The flight plan videos were obtained from the video processing group as .MP4 files and as URLs to videos uploaded by them to YouTube. These were stored locally on the server or integrated in the web page with a URL in a the dedicated Video section.
Lastly, the supervised classification layer (land use and land cover) required a unique visualization method. First, the raw data (the supervised a raster image was first converted to from raster to a vector shapefile (using ArcGIS’s raster to polygon). Secondly, the shapefiles were processed into a multiple feature GeoJSON’s and visualized accordingly using a Leaflet plug-in.
Architecture
The UAaS web application is based on an MVC (Model View Controller) architecture which consists of three important components: the Client, ESRI Cloud Services, and the Web Server (Fig. 1 below).
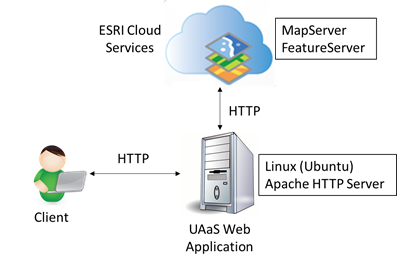
Figure 1: Architecture of the UAaS web application.
The application is able to retrieve, from the ESRI Cloud Services, several maps and features such as Orthomosaic and Flight Plan respectively, and other layers that can be found in more details in the 'Data' section above.
The platform was developed using Angular JS, HTML, CSS, Leaflet JS and ESRI Leaflet JS. Using the Angular JS’s properties $watch and $mdMedia, the application is able to distinguish the size of the clients’ screen, and adapt the user interface in order to display in a proper way the layout and functionality of the application. Other advantage of using Angular JS is that it allows to decouple the javascript functions that control the web pages and reuse them in any place without losing its integrity. Leaflet and ESRI Leaflet JS were used to display all the map functionalities, such as the selection of basemaps and layers, as well as to create animated layers such as the Floating Point.
Functions and Widgets
Map
The map contains a layer control, which enables the users to select one of three base layers and all other layer. A legend has been integrated, which updates its content descriptions according to the corresponding selected layers (see Fig. 2).
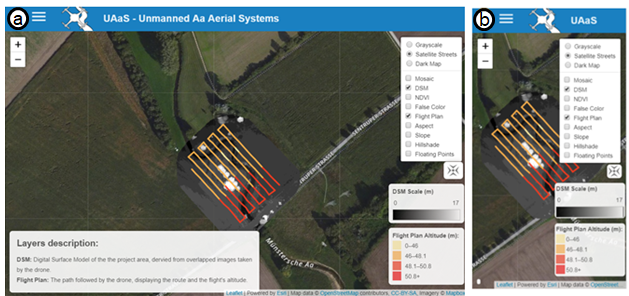
Figure 2: The opened layer control and the legends according to the selected layers of the web applications map (a) on desktop and (b) on mobile.
The more complex and interesting feature is the visualization of the floating experiments. The floating points layer visualizes the three conducted experiments. On selection, the web application shows a selection menu on the bottom of the site. The menu consists of an experiment selection menu, a play/pause button, a videospeed selection menu, a elapsed time display, and a timeslider. Each experiment is visualized in a different color and the timeslider-pointer adapts its color according to the selected experiment (see Fig. 3).
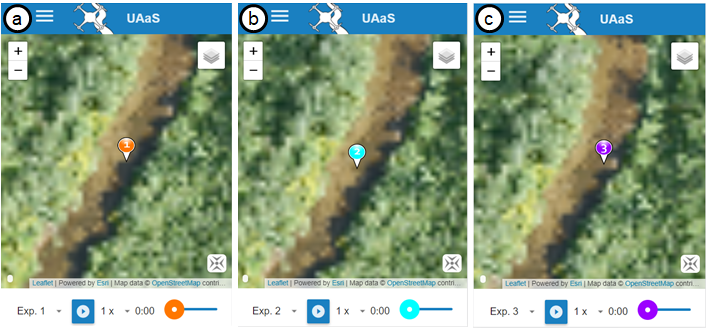
Figure 3: The visualization of the floating points on mobile of (a) experiment one, (b) experiment two, and (c) experiment three.
3D Esri Cloud Web Scene
The 3D section is an interactive visualization of collected data and processed images of the drone flight. Each layer was integrated into the Web application using ESRI Cloud Web Service. The visualizations of the layers are presented in the web application (see Fig. 4). A combination of layers from different layer groups can be selected and then all being visualized at the same time. Although lots of the layer combination selections are questionable use cases, we did not limit the users' possibilities and let them decide on their own which combination of layers is visualized.
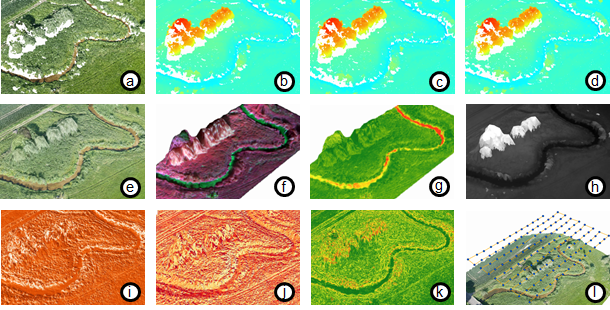
Figure 4: The visualization of the floating points on mobile of (a) experiment one, (b) experiment two, and (c) experiment three.
Results
The web portal succeeded in visualizing and sharing various hypertext and multimedia products obtained by the UAVs. The Model View Controller (MVC) architecture, in the AngularJS and Leaflet framework enabled to customize the interface for the particular projects’ context and develop an interactive, mobile-friendly Web application. The responsive design of the page enabled to utilize the app in smaller screen as well as toggle behavior of content with the help of AngularJS and the HTML5 and CSS specifications. The ‘toggle’ property allowed to visualize the content of the page, controlling the content to create a minimized appearance, as seen in Figure 5.
A complete web application to visualize the various formats of data for the particular ecological use-case was designed. The main visualization platform (‘MAP’), can be seen in Fig 5. displaying the following layers: Mosaic, NDVI Map, Digital Elevation Model, flight path and the river's flow rates information.
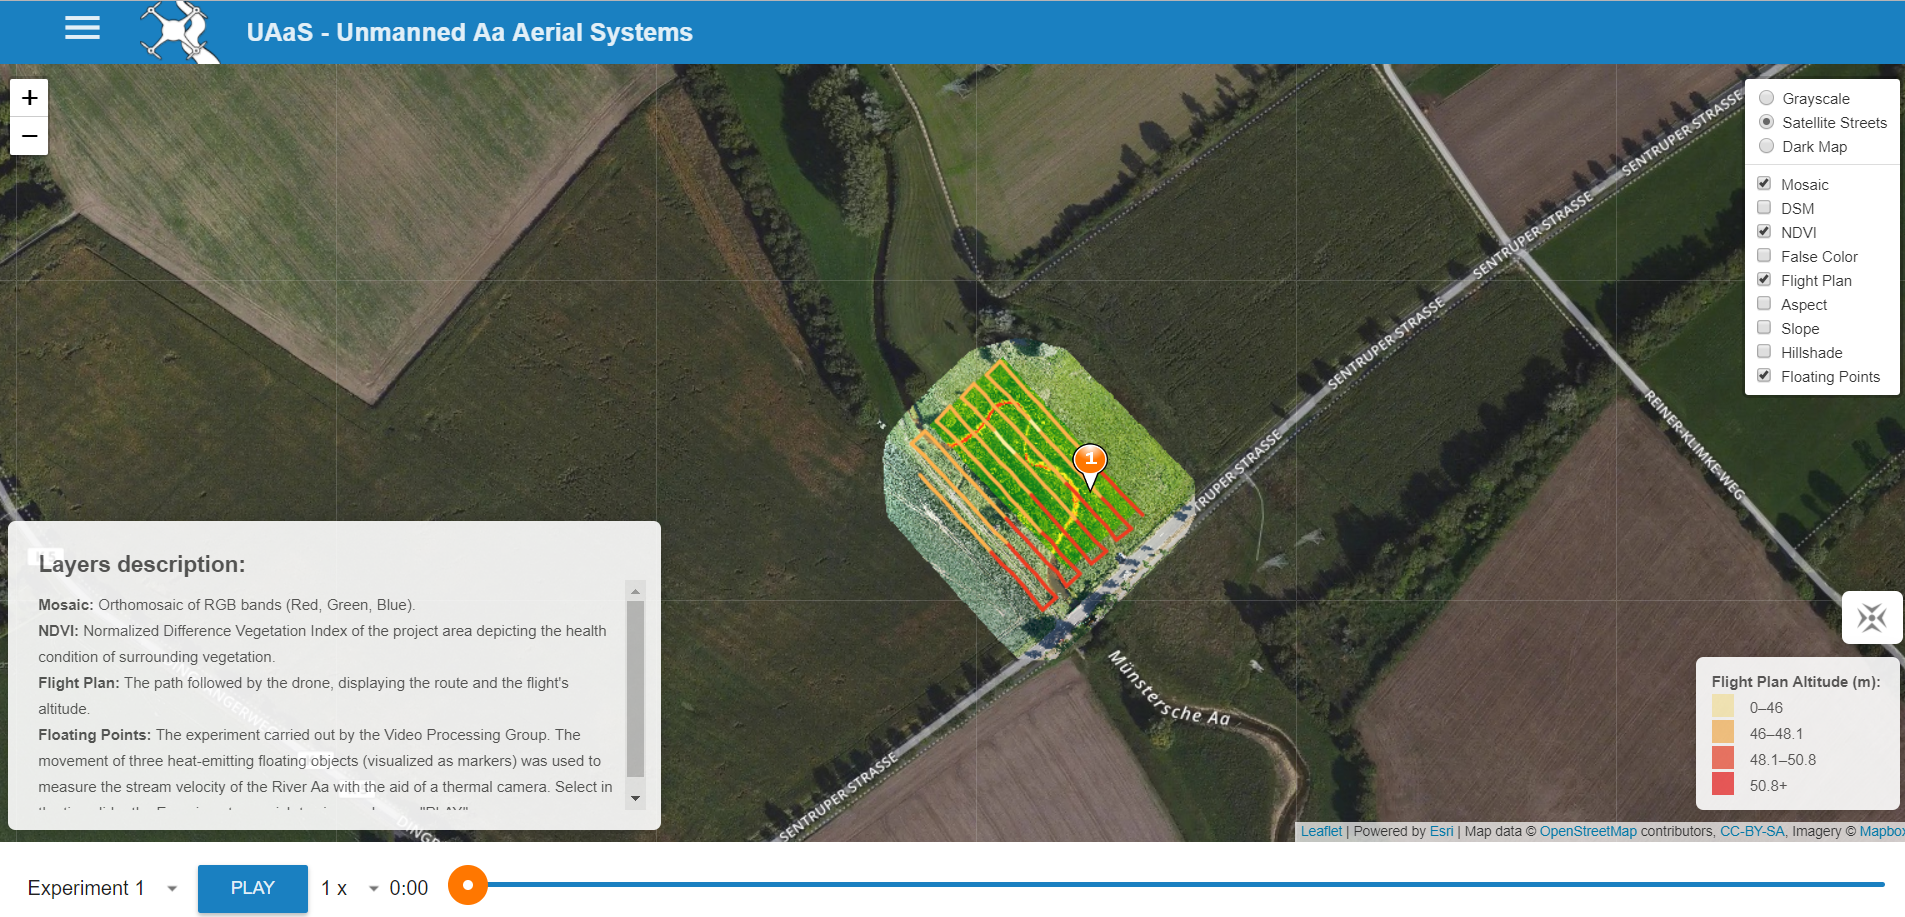
Figure 5: The map area with different base maps to overlay DSM, NDVI, mosaic and float points written in the layer description of the the figure.
Setup
Visit the GitHub for installation how to run the Web App and Server locally using NPM, Bower and Gulp.Back to my projects →